


 207 / 354

173
National Health Profile 2018
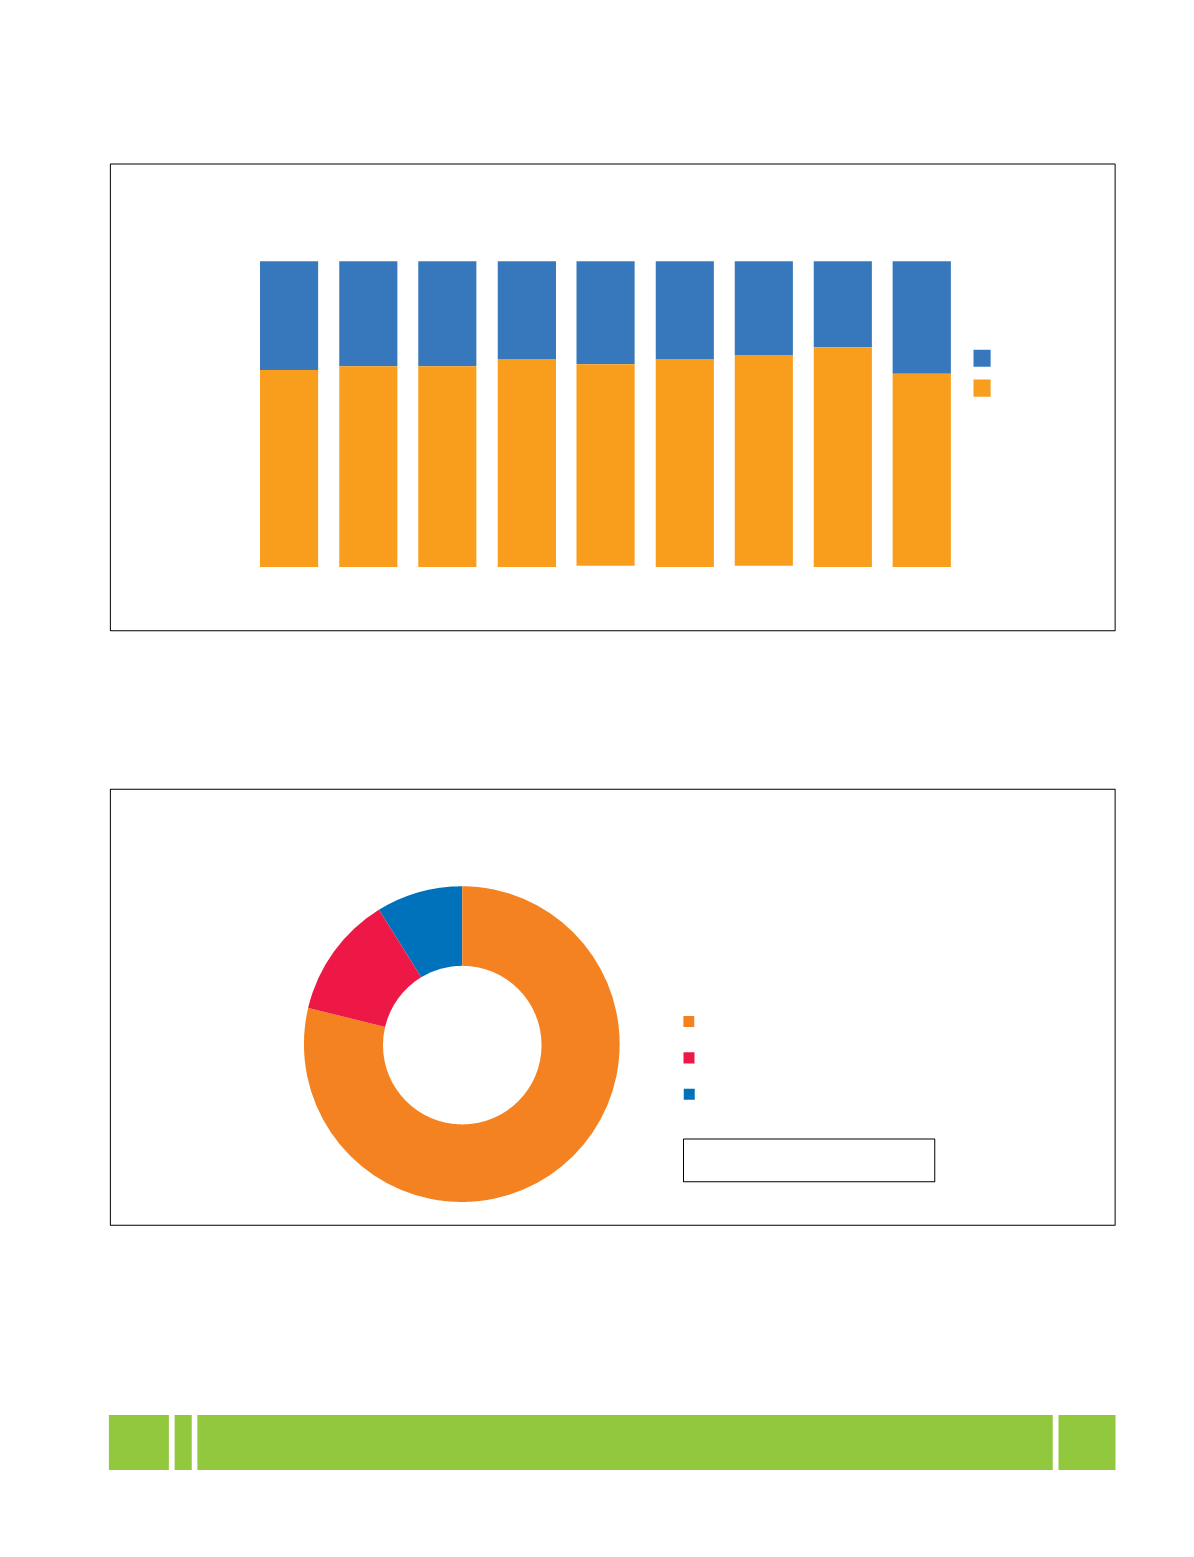
2009-10 2010-11 2011-12 2012-13 2013-14 2014-15 2015-16 2016-17 2017-18
(RE)
(BE)
64% 65% 65% 67% 66% 67% 69% 71% 63%
36% 35% 35% 33% 34% 33% 31% 29% 37%
100%
80%
60%
40%
20%
0%
Year
Centre
State
Source:
“Health Sector Financing by Centre and states/UTs in India 2015-16 to 2017-18”,
National Health Accounts Cell, Ministry of Health & Family Welfare
Figure 4.1.2: Composition (%) of Total Public Expenditure on Health in 2015-16
Source:
“Health Sector Financing by Centre and states/UTs in India 2015-16 to 2017-18”,
National Health Accounts Cell, Ministry of Health & Family Welfare
Notes:
For explanations, please refer to Description on Page 169
*
Others include Medical reimbursement/ Medical Treatment expenditure, other departments’ expenditure within the health
demand, Secretariat Social Service Expenditure (2251), and medical expenditure by Ministry of Defence, Labour & Employment,
Railways, Science & technology, Mines & Post.
12.6%
8.8%
78.7%
Family Welfare
Medical & Public Health
Othe rs*
Grand Total = 140054 Crores
Figure 4.1.1: Trends in Centre-State share (%) in Total Public Expenditure on Health