


 212 / 354

178
National Health Profile 2018
4.
Gross State Domestic Product (GSDP) at Current Prices with base year 2011-12 (as on 28-02-2018) from Central Statistics Office,
Ministry of Statistics & Programme Implementation.
Notes :
*
2015-16 revised estimated figures are given for State Expenditure on Health and Total State Expenditure.
$
Population for Andhra Pradesh and Telangana are taken from Socio Economic Survey published by Andhra Pradesh and Statistical Year Book
2015 of Telangana respectively.
#
Total State Expenditure includes Revenue expenditure, Capital Outlay (Development &Non-Development) and Loans and Advances by State
Governments (Development purposes & Non Development purposes)
**
EAG+1 States includes Assam
@
GSDP figures for West Bengal, Dadra &Nagar Haveli, Daman & Diu and Lakshadweep are not available.
^
Major Non EAG States spend 5.34% of total state expenditure on health.
&
The ratio of public expenditure on health to GSDP is computed by taking 2015-16 (RE) of public expenditure on health and 2015-16 (Actuals)
of GSDP.
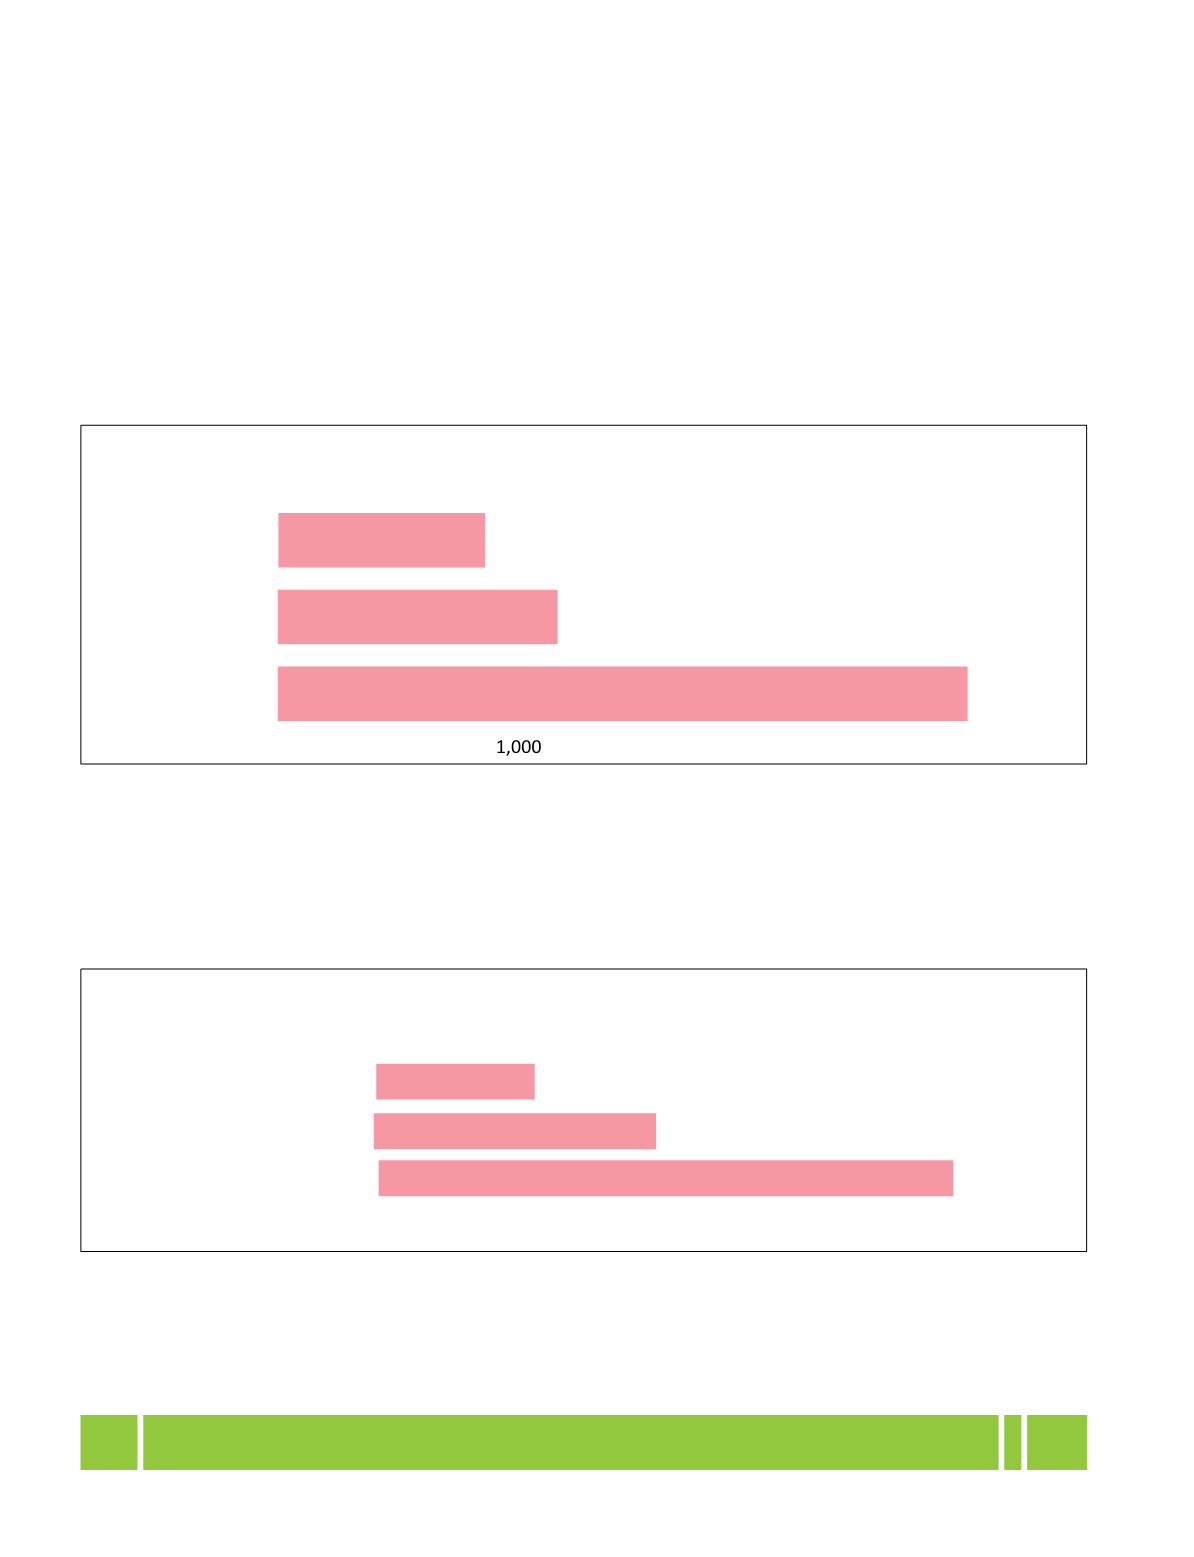
Figure 4.1.6: Average Per Capita Public Health Expenditure, 2015-16 (RE) in Rs.
Source:
1
“Health Sector Financing by Centre and States/UTs in India”, National Health Accounts Cell, Ministry of Health & Family
Welfare.
2
“Report of the Technical Group on Population Projections may 2006”, National Commission on Population, Registrar General of
India.
Status
EAG + 1
States
Major (Non
EAG) States
North East
States
871
1,172
0
2,000
3,000
2,878
Figure 4.1.7: Public Health Expenditure as a share of GSDP, 2015-16
Source:
1
“Health Sector Financing by Centre and States/UTs in India 2015-16 to 2017-18”, National Health Accounts Cell, Ministry of
Health & Family Welfare.
2
Gross State Domestic Product (GSDP) at Current Prices with base year 2011-12 (as on 28-02-2018) from Central Statistics Office,
Ministry of Statistics & Programme Implementation.
Status
Major (Non EAG) States
EAG + States
North East States
0.76%
1.36%
2.76%
3.00%
2.50%
2.00%
1.50%
1.00%
0.50%
0.00%