


 222 / 354

188
National Health Profile 2018
4.4 PUBLIC EXPENDITURE ON HEALTH – INTERNATIONAL COMPARISON
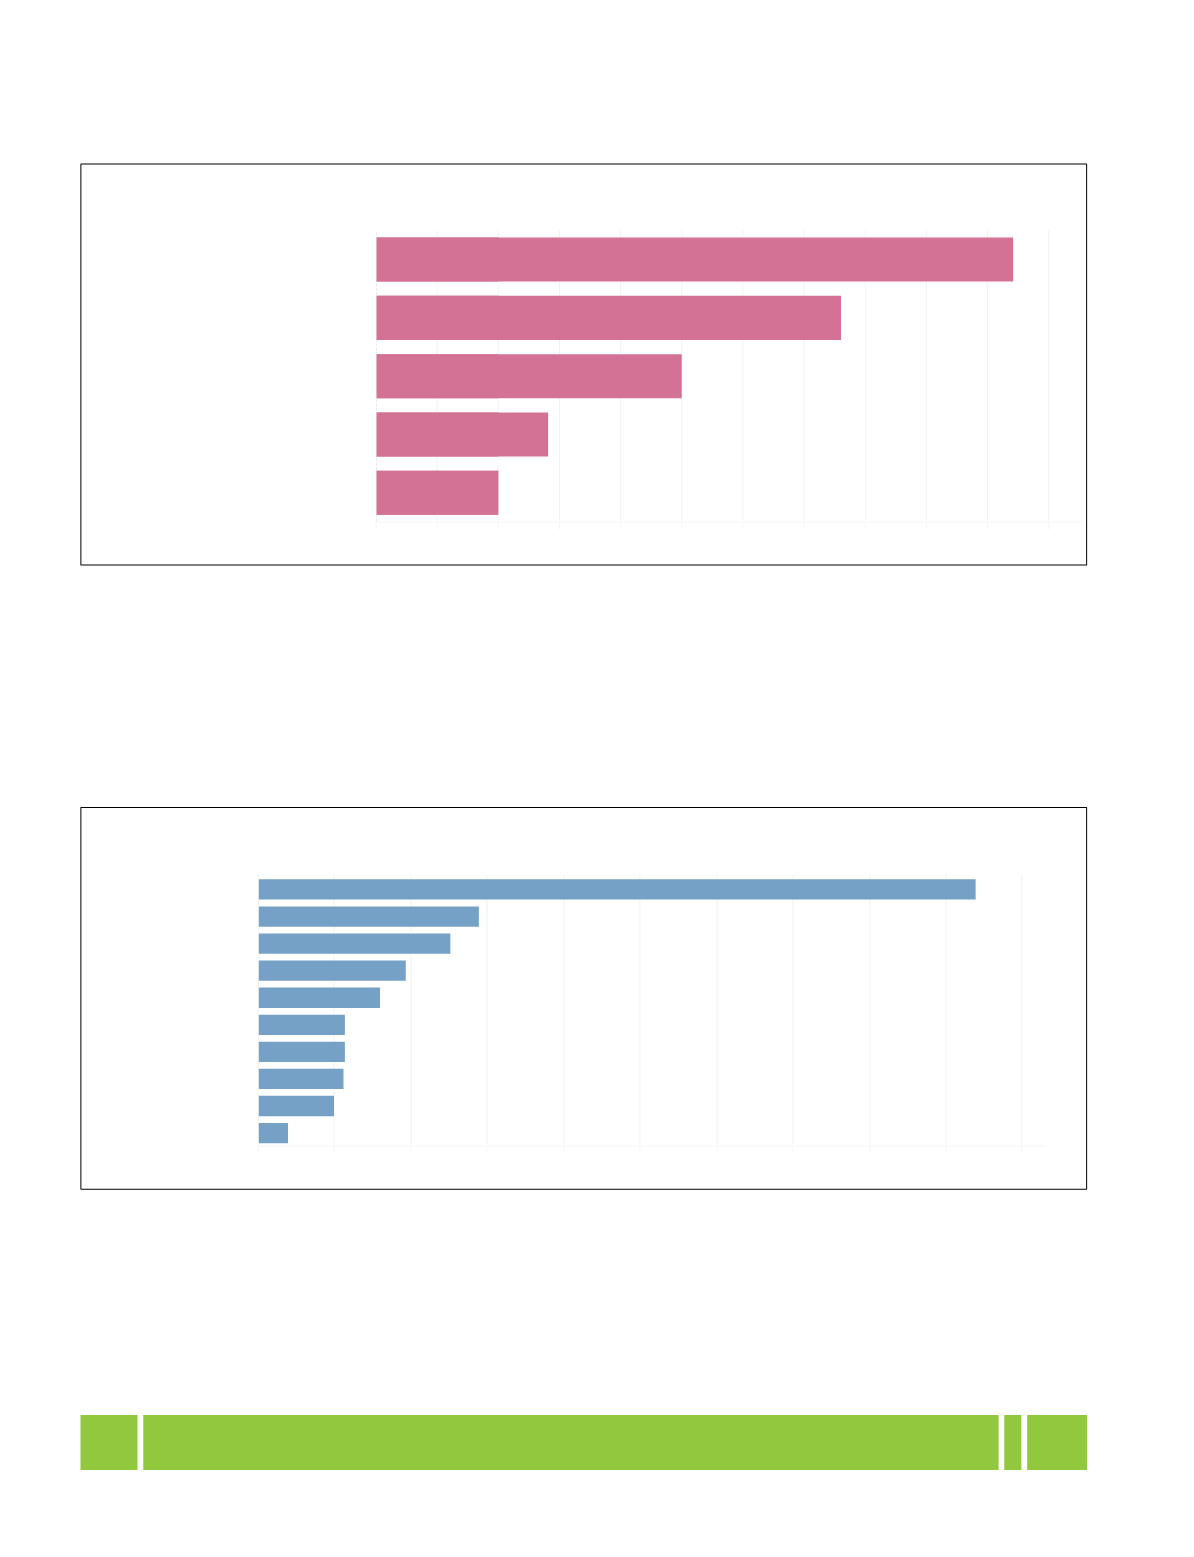
Figure 4.4.1: Public Expenditure on Health as a % of GDP across World Bank Income Groups - 2015
Figure 4.4.2: Public Expenditure on Health as a % of GDP for SEAR Countries- 2015
Source:
Global Health Expenditure Database, World Health Organization accessed from
http://apps.who.int/nha/database/Select/Indicators/en as on 11.04.2018
Notes:
1. For India, see Table 4.1.2 of Chapter 42. As per System of Health Accounts 2011 (SHA 2011), Domestic General Government Health Expenditure as a % of GDP (GGHE-
D%GDP) is taken as Public Expenditure on Health as a % of GDP (Technical brief on the Indicators published on the World Health
Organization’s Global Health Expenditure Database accessed from
http://apps.who.int/nha/database/DocumentationCentre/Index/en
Source:
Global Health Expenditure Database, World Health Organization accessed from
http://apps.who.int/nha/database/Select/Indicators/en ason 11.04.2018
N
otes: 1. For India, see Table 4.1.2 of Chapter 42. SEARO countries exclude Democratic People’s Republic of Korea due to data being unavailable.
3. As per System of Health Accounts 2011 (SHA 2011), Domestic General Government Health Expenditure as a % of GDP (GGHE-
D%GDP) is taken as Public Expenditure on Health as a % of GDP (Technical brief on the Indicators published on the World Health
Organization’s Global Health Expenditure Database accessed from
http://apps.who.int/nha/database/DocumentationCentre/Index/en
World Bank Income Groups
0.0 0.5 1.0 1.5 2.0 2.5 3.0 3.5 4.0 4.5 5.0 5.5
High Income countries
Upper Middle Income
countries
Lower Middle Income
countries
Low Income countries
India
5.2
3.8
2.5
1.4
1.0
Figure 4.4.1: Public Expenditure on Health as a % of GDP across World Bank Income
Groups - 2015
Source:
Global Health Expenditure Database, World Health Organization accessed from
http://apps.who.int/nha/database/Select/Indicators/enas on 11.04.2018
Notes:
1. For India, see Table 4.1.2 of Chapter 4
2. As per System of Health Accounts 2011 (SHA 2011), D
omes�c General Government HealthExpenditure as a % of GDP (GGHE-D%GDP) is taken as Public Expenditure on Health as a % of GDP
(Technical brief on the Indicators published on the World Health Organiza�on’s Global Health
Expenditure Database accessed from
h�p://apps.who.int/nha/database/Documenta�onCentre/Index/en
).
SEAR countries
0.0 1.0 2.0 3.0 4.0 5.0 6.0 7.0 8.0 9.0 10.0
Maldives
Thailand
Bhutan
Timor-Leste
Sri Lanka
Indonesia
Myanmar
Nepal
India
Bangladesh
9.4
2.9
2.5
1.9
1.6
1.1
1.1
1.1
1.0
0.4
Figure 4.4.2: Public Expenditure on Health as a % of GDP for SEAR Countries- 2015
Source:
Global Health Expenditure Database, World Health Organization accessed from
http:// apps.who.int/nha/database/Select/Indicators/ enas on 11.04.2018
Notes:
1. For India, see Table 4.1.2 of Chapter 4
2. SEARO countries exclude Democra�c People’s Republic of Korea due to data being unavailable.
3. As per System of Health Accounts 2011 (SHA 2011), Domes�c
General Government Health Expenditure asa % of GDP (GGHE-D%GDP) is taken as Public Expenditure on Health as a % of GDP (Technical brief on the
Indicators published on the World Health Organiza�on’s Global Health Expenditure Database accessed from
h�p://apps.who.int/nha/database/Documenta�onCentre/Index/en
).