


 46 / 354

17
National Health Profile 2018
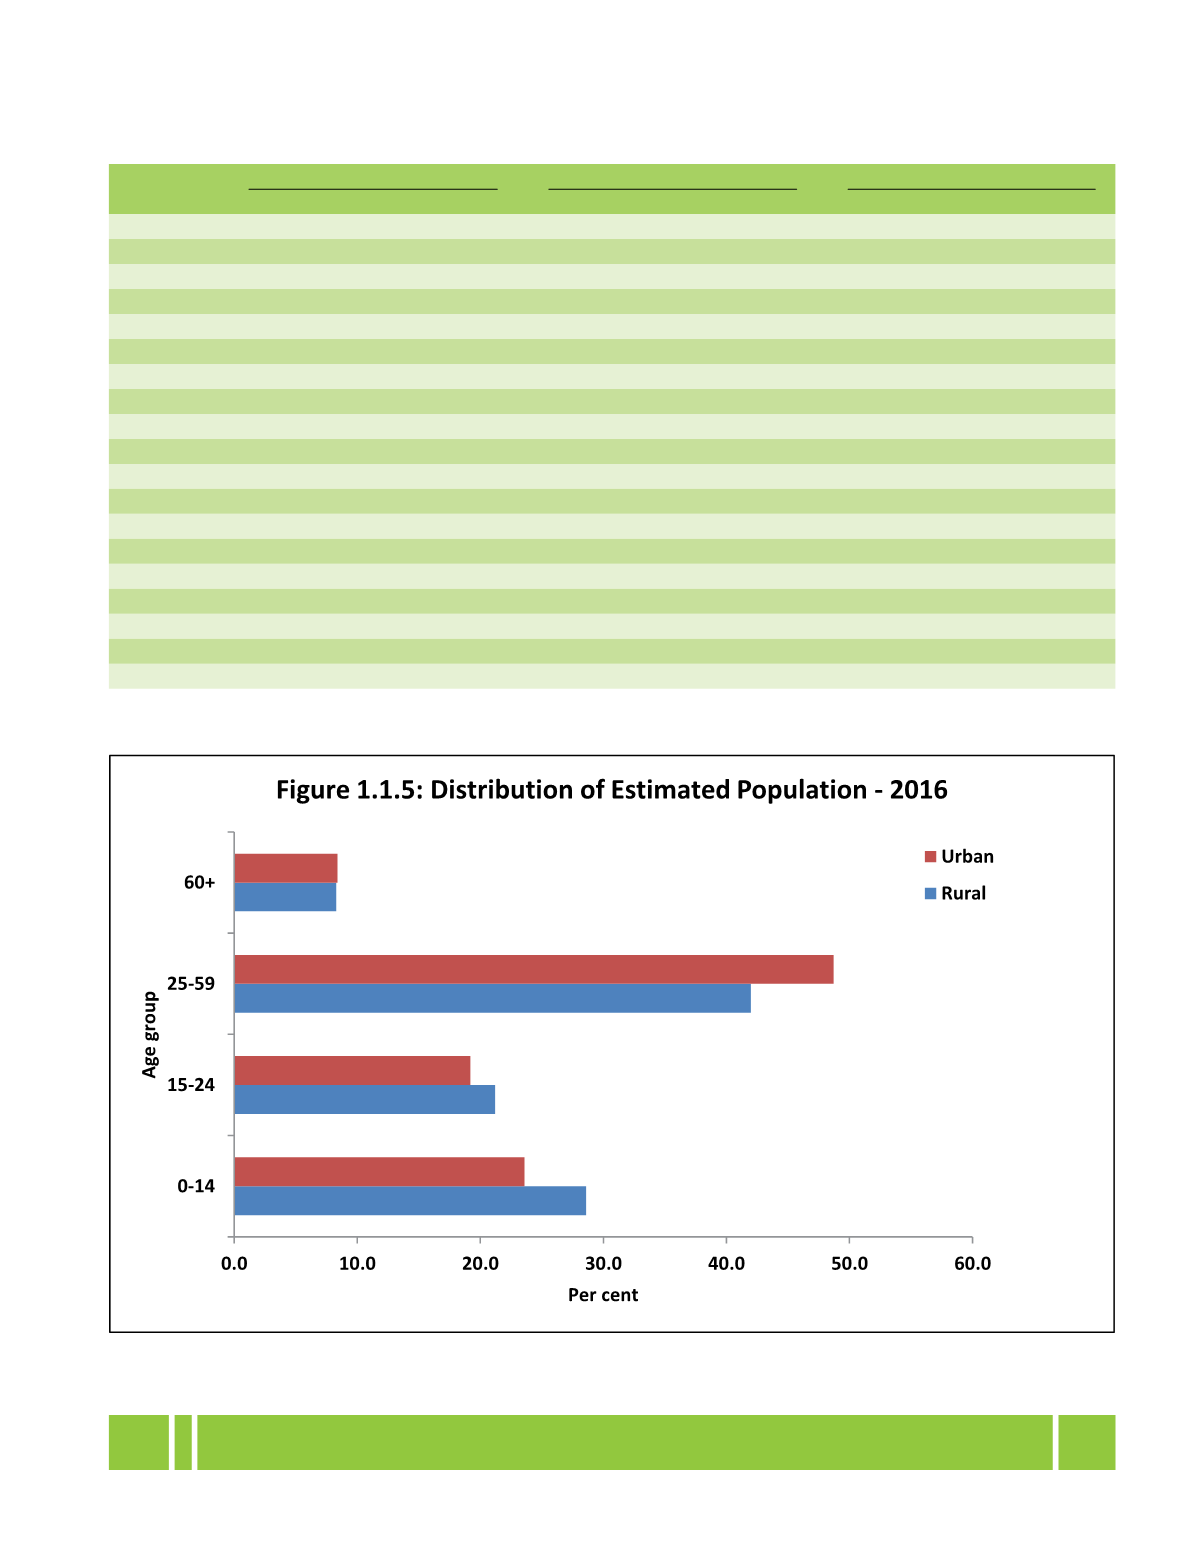
1.1.4(b) Percentage distribution of estimated population by age-group, sex and residence, 2016
Age Group
Total
Rural
Urban
Total
Males
Females
Total
Males
Females
Total
Males
Females
0-4
8.5
8.7
8.2
9.1
9.3
8.8
7.2
7.4
7.0
5-9
8.9
9.1
8.8
9.4
9.6
9.2
7.9
8.1
7.8
10-14
9.6
9.8
9.4
10.1
10.3
9.9
8.5
8.7
8.3
15-19
10.1
10.4
9.9
10.6
10.9
10.3
9.1
9.3
8.9
20-24
10.4
10.2
10.7
10.6
10.4
10.8
10.1
9.8
10.4
25-29
9.7
9.5
9.8
9.4
9.3
9.4
10.2
9.9
10.6
30-34
8.1
8.1
8.0
7.6
7.7
7.6
9.0
9.0
9.0
35-39
7.1
7.0
7.2
6.7
6.6
6.8
7.8
7.8
7.8
40-44
6.1
6.1
6.1
5.8
5.8
5.8
6.9
6.9
6.8
45-49
5.3
5.3
5.4
5.1
5.1
5.1
5.8
5.8
5.8
50-54
4.3
4.4
4.3
4.0
4.1
3.9
5.0
5.0
5.1
55-59
3.6
3.5
3.7
3.4
3.2
3.6
4.0
4.0
4.0
60-64
3.1
3.0
3.1
3.0
2.9
3.1
3.2
3.3
3.2
65-69
2.2
2.1
2.2
2.2
2.1
2.2
2.2
2.2
2.2
70-74
1.5
1.4
1.5
1.5
1.4
1.6
1.4
1.4
1.5
75-79
0.9
0.8
0.9
0.9
0.8
1.0
0.8
0.8
0.9
80-84
0.5
0.4
0.5
0.4
0.4
0.5
0.5
0.4
0.5
85+
0.3
0.2
0.3
0.3
0.3
0.3
0.3
0.2
0.3
Total
100.0
100.0
100.0
100.0
100.0
100.0
100.0
100.0
100.0
Source:
SRS Statistical Report 2016, O/o Registrar General of India
Notes :
Total may not add up to 100 due to rounding.
Source:
SRS Statistical Report 2016, O/o Registrar General of India