


 182 / 354

150
National Health Profile 2018
Source:
O/o Registrar General of India.
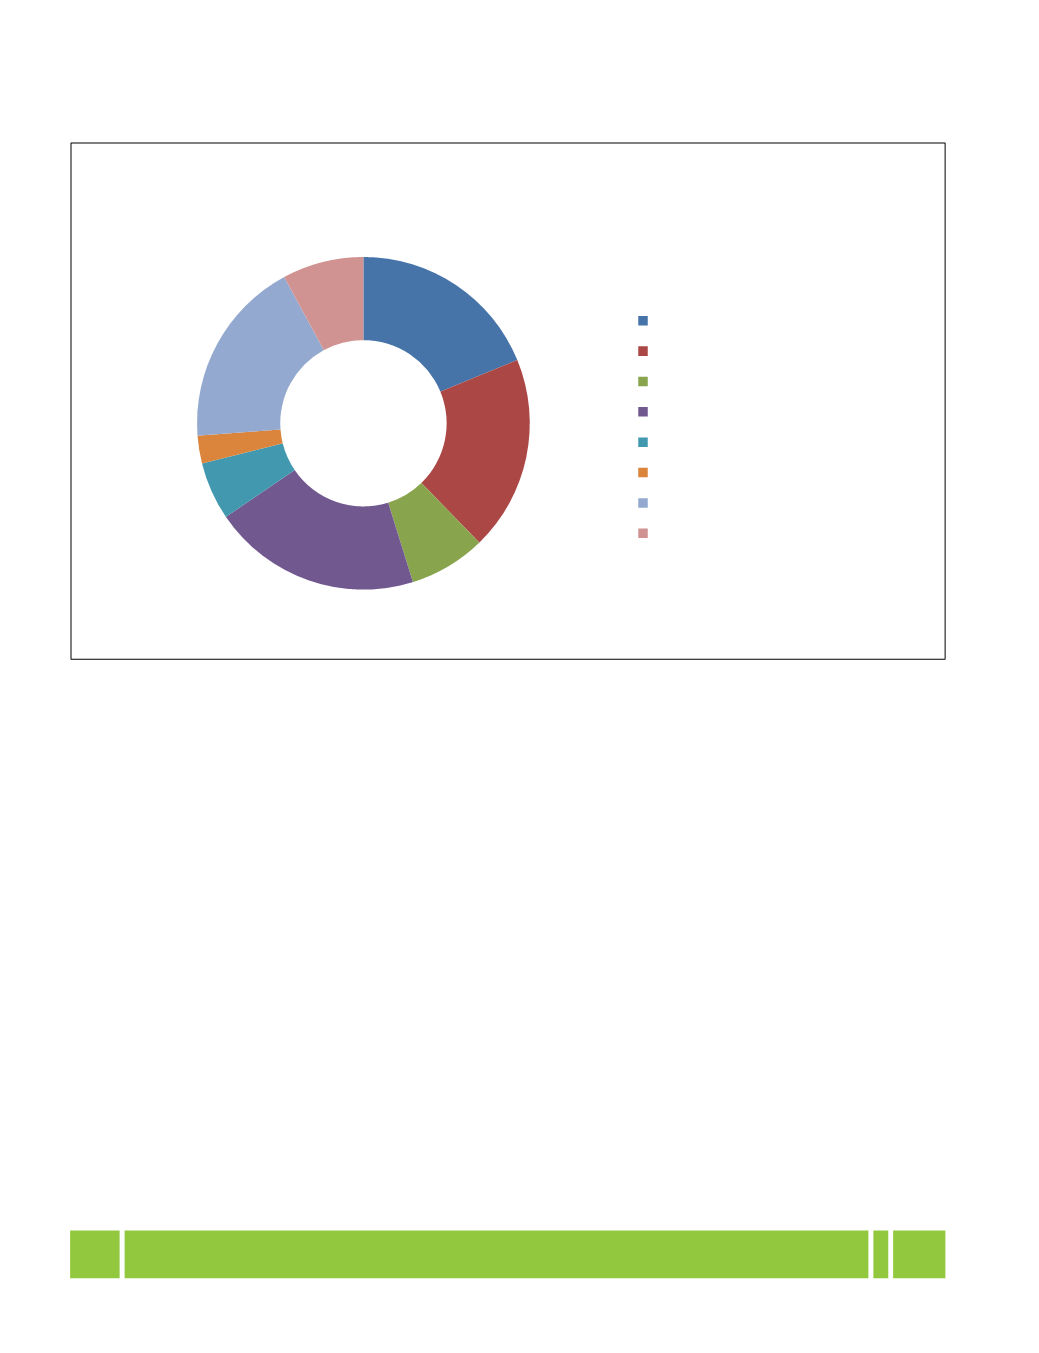
19%
19%
7%
20%
6%
3%
18%
8%
Figure 3.2.4: Proportion of Disabled Population by Type of Disability
Census 2011
In seeing
In Hearing
In Speech
In Movement
Mental Retardation
Mental Illness
Any Other
Multiple Disability